Backtraces & Interception
Native applications (C, C++, etc.) can crash for many reasons—from chasing a bad pointer to hitting an assert() or failing to handle an exception. Turbostar wraps test and application execution with a special LD_PRELOAD library (libturbocatch.so) that intercepts key signals and carefully writes a stack trace to a dedicated location.
The main Turbostar application uses this backtrace file to decode addresses (something that is not safe to do inside signal handlers) and turn them into an actionable report. Turbostar maintains an internal crash database so users and AI agents can review crash details at any time. For human editor users, backtrace entries within the project include a "go to source" option.
Human & Agent-Friendly Crash Reports
To ensure both the agent and the developer share the same high-quality context, crash reports are formatted exactly how a human reverse-engineer would expect to see them. They include signal information, fully resolved DWARF backtraces, and a Codemap summary mapping stack frames directly to function boundaries:
## Crash Report

### Info
Signal: 11
CrashAddress: 0x0 (read)
Type: SEGV_MAPERR
Executable: /home/arjan/git/turbotest9a/build/testcase
CrashCookie: run_1001

### Backtrace
| Frame | Address          | Function        | Location                                                                      |
|-------|------------------|-----------------|-------------------------------------------------------------------------------|
| 0     | `0x7f59d6d74ca9` | `__strcpy_avx2` | /build/reproducible-path/glibc-2.42/sysdeps/x86_64/multiarch/strcpy-avx2.S:80 |
| 1     | `0x5576dedcf168` | `foo(char*)`    | main.cpp:10:5                                                                 |
| 2     | `0x5576dedcf1ae` | `main`          | main.cpp:17:9                                                                 |

### Codemap Summary
| path       | Symbol | start_line | end_line | lines |
|------------|--------|------------|----------|-------|
| `main.cpp` | `foo`  | 5          | 11       | 7     |
| `main.cpp` | `main` | 12         | 18       | 7     |

### Coredump Debugging
A coredump is available for this crash. You can launch a GDB session to debug this coredump by calling the 'agent_debug_coredump' tool.
Steering the Agent (Least Friction Principle)
Many LLMs will try to guess the issue based on minimal logs, jumping to incorrect conclusions on complex bugs. Turbostar uses the Least Friction Principle: we inject the crash root cause directly into the execution tool output so the LLM has zero friction diagnosing it.
When an application crashes, the agent receives an immediate, structured notification explicitly telling it how to retrieve the coredump:
{
  "crash_notification": "\n\nCRASH DETECTED: Application crashed (Crash ID: 1028928).\nSummary: assertion fail at ../main.cpp:8 `c != NULL` in void foo(char*)()`\nPlease use 'crashdump_get_info' with crash_id '1028928' to investigate stack trace and details.",
  "is_alive": false,
  "status": "ended"
}
Generating Coredumps
Coredumps are the ultimate data source for analyzing crashes, containing a full memory snapshot of the application at the moment of failure. However, reliably generating a coredump file turns out to be a nightmare of Linux distribution-specific quirks. Systemd's coredumpctl? Not on Debian. Running ChromeOS? Forget it. Running inside a container? All bets are off.
Turbostar uses coredumpctl if available, but libturbocatch.so additionally triggers execution of gdb's gcore utility to produce a kernel-independent coredump file. While neither tool is individually perfect, this dual-attempt approach ensures coredumps are reliably generated for every crash.
Agent GDB Architecture
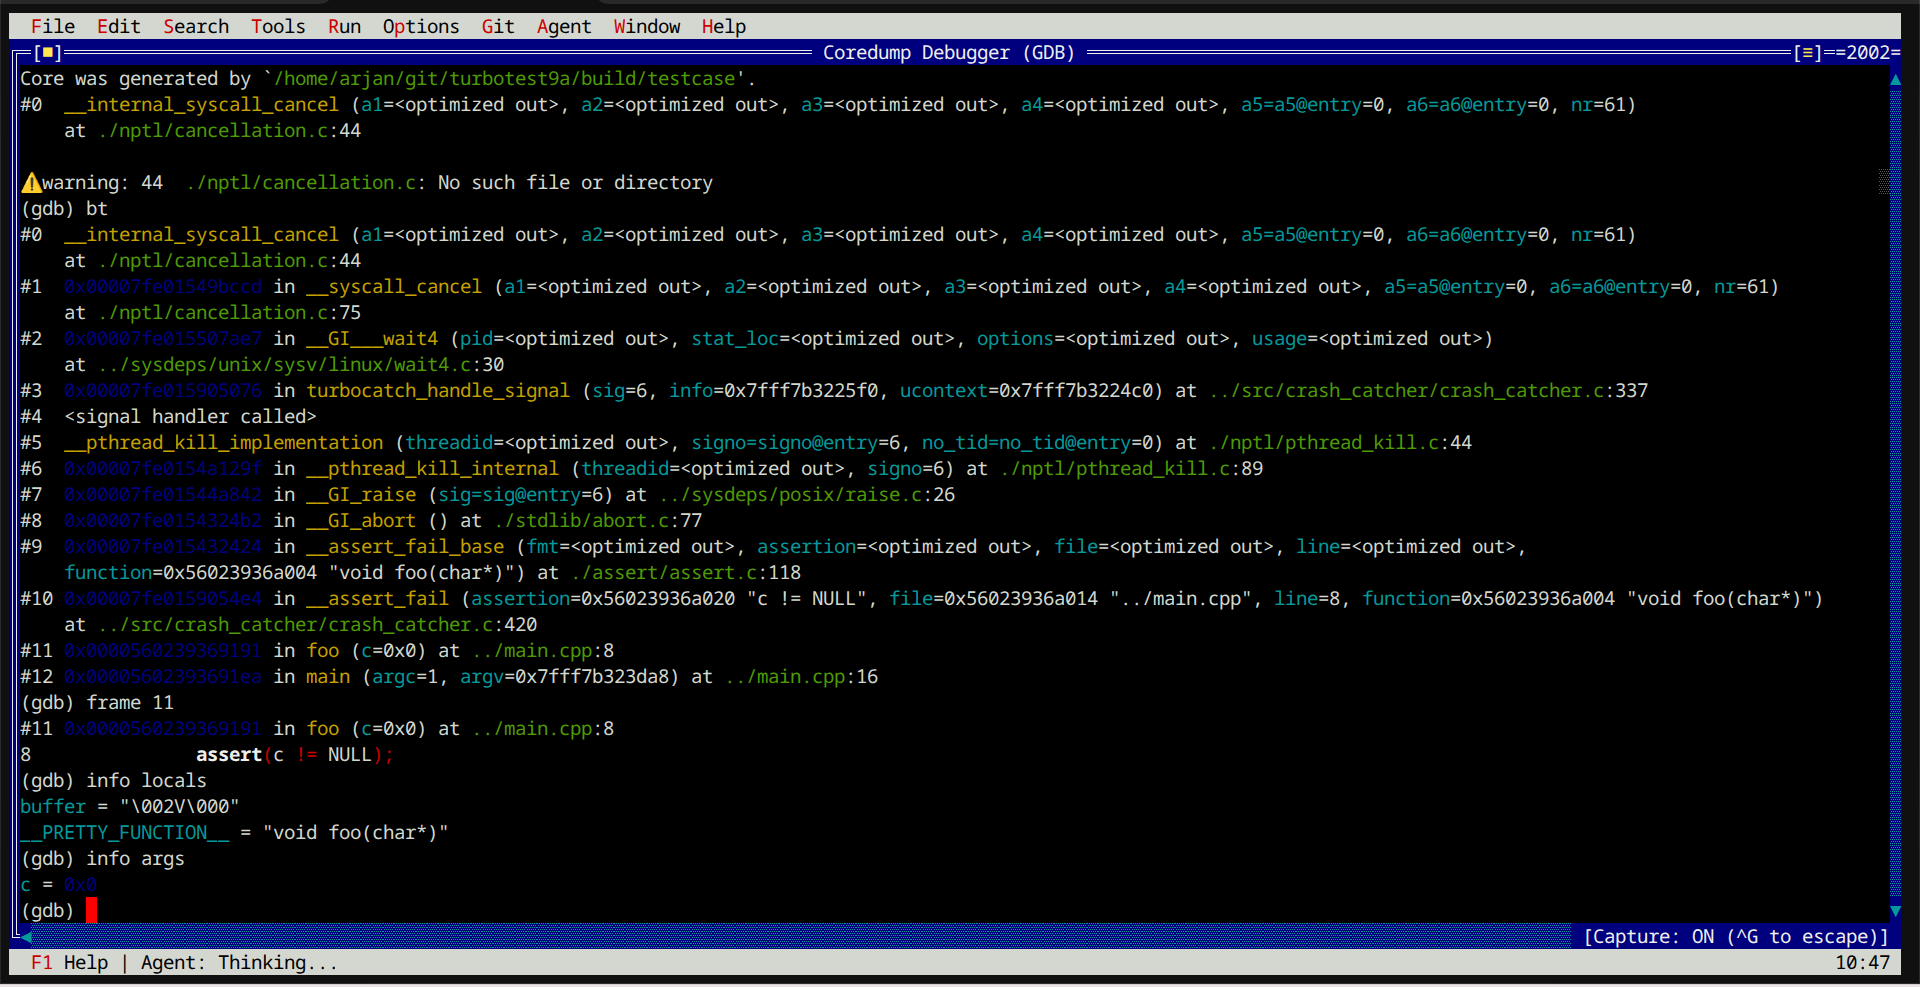
From the backtrace details, a one-click "GDB window for the coredump" option is available to human editor users, while a fully interactive gdb session is just one tool call away for AI agents.
Instead of forcing the LLM to run bash commands blindly, Turbostar acts as a mediator: the LLM sends commands (like info locals), and Turbostar pipes them through gdbserver to the application, parsing the output back cleanly to the LLM.
// Example GDB Tool Call Result:
frame 11
#11 0x0000560239369191 in foo (c=0x0) at ../main.cpp:8
8 assert(c != NULL);
(gdb) info locals
buffer = "\002V\000"
(gdb) info args
c = 0x0
An example crash dump provided to an AI agent can be viewed on GitHub.